
This post will be about pulling free data from AlphaVantage, and gauging interest for a volatility trading subscription service.
So first off, ever since the yahoos at Yahoo decided to turn off their free data, the world of free daily data has been in somewhat of a dark age. Well, thanks to http://blog.fosstrading.com/2017/10/getsymbols-and-alpha-vantage.html#gpluscommentsJosh Ulrich, Paul Teetor, and other R/Finance individuals, the latest edition of quantmod (which can be installed from CRAN) now contains a way to get free financial data from AlphaVantage since the year 2000, which is usually enough for most backtests, as that date predates the inception of most ETFs.
Here’s how to do it.
First off, you need to go to alphaVantage, register, and https://www.alphavantage.co/support/#api-keyget an API key.
Once you do that, downloading data is simple, if not slightly slow. Here’s how to do it.
require(quantmod)

getSymbols('SPY', src = 'av', adjusted = TRUE, output.size = 'full', api.key = YOUR_KEY_HERE)
And the results:
> head(SPY)
           SPY.Open SPY.High SPY.Low SPY.Close SPY.Volume SPY.Adjusted
2000-01-03   148.25   148.25 143.875  145.4375    8164300     104.3261
2000-01-04   143.50   144.10 139.600  139.8000    8089800     100.2822
2000-01-05   139.90   141.20 137.300  140.8000    9976700     100.9995
2000-01-06   139.60   141.50 137.800  137.8000    6227200      98.8476
2000-01-07   140.30   145.80 140.100  145.8000    8066500     104.5862
2000-01-10   146.30   146.90 145.000  146.3000    5741700     104.9448
Which means if any one of my old posts on asset allocation has been somewhat defunct thanks to bad yahoo data, it will now work again with a slight modification to the data input algorithms.
Beyond demonstrating this routine, one other thing I’d like to do is to gauge interest for a volatility signal subscription service, for a system I have personally started trading a couple of months ago.
Simply, I have seen other websites with subscription services with worse risk/reward than the strategy I currently trade, which switches between XIV, ZIV, and VXX. Currently, the equity curve, in log 10, looks like this:
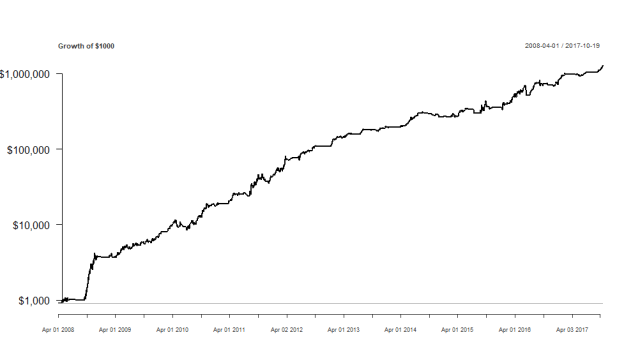
That is, $1000 in 2008 would have become approximately $1,000,000 today, if one was able to trade this strategy since then.
Since 2011 (around the time of inception for XIV), the performance has been:
                        Performance
Annualized Return         0.8265000
Annualized Std Dev        0.3544000
Annualized Sharpe (Rf=0%) 2.3319000
Worst Drawdown            0.2480087
Calmar Ratio              3.3325450
Considering that some websites out there charge upwards of $50 a month for either a single tactical asset rotation strategy (and a lot more for a combination) with inferior risk/return profiles, or a volatility strategy that may have had a massive and historically record-breaking drawdown, I was hoping to gauge a price point for what readers would consider paying for signals from a better strategy than those.
Thanks for reading.
NOTE: I am currently interested in networking and am seeking full-time opportunities related to my skill set. My LinkedIn profile can be found here.

Let me know what you decide to charge… if nothing else it would be great to support your work… Many thanks!
Thanks. Still would like to get a gauge of interest on a whole.
where i can subscribe ? :)
Still considering whether or not to set it up, seeing what the market will bear.
Pingback: The Return of Free Data and Possible Volatility Trading Subscription – Mubashir Qasim
How much is out of sample? Also, does it hold just one of those assets and rotates between them, or holds them in varying fractions?
Rotation.
Pingback: The Return of Free Data and Possible Volatility Trading Subscription | A bunch of data
compare yours with other vol strats at collective2.com. with some digging, you can guestimate how many subscribers the more popular strategies have by looking at their public autotrading records. best guess is that good strats get 20-50 subscribers, best few get 100 or more. no subscribers until you get a good public record though, some months at least, or outperform the competition during a volatile vol spell.
I would be interested. Sorry not helpful in the pricing area.
the backtest doesn’t include data prior to 2008, just before a sharp drawdown in all VIX strategies if you use reconstructed data (these etfs haven’t started trading). you must know that, right?
the curve is highly optimized. I know that because your max drawdown is very low for this strategy. you will do well if the current environment continues. but will have shockingly large drawdowns if the environment changes.
i suggest you allow more losses in your strategy to make it more robust…
Prior to 2008, my signal process didn’t exist. And while there may have been some optimization, this was a setting I’ve actually been following for a couple of years without investing money into it. In short, a more prototypical variant of this system has had some decent out-of-sample performance already.
Pricing: knowing what I don’t know now, my price is less than $25/month. Before you get any realistic “bids” for the audience who follows you, you need to have a full description of training and testing. I want to know the process you used to develop the system: train,validate, test data groups? What is the trading frequency? how many trades a year?
Try something radical like a sliding scale on how well the strategy performs. I don’t mind paying more if I am earning 5%/month
Previous commenter is right: not much data for developing and testing, and it has been an up market for the whole time.
Well, I can’t really go into detail about how I developed the strategy. The trading signal uses daily resolution data, and has around 50 transactions a year (so about once a week, give or take).
I might well give your VXX strategy a go if you make it available, but more valuable would be a strategy that trades some other vol market. EVIX/EXIV, for instance.
dangerous to invest in a vol strategy that doesn’t include 2008 in the backtest
2008 was the best year for the backtest.
Close
2008-12-31 2.8300205
2009-12-31 0.7635791
2010-12-31 1.5175673
2011-12-30 1.3492086
2012-12-31 1.4056943
2013-12-31 0.7780840
2014-12-31 0.3483828
2015-12-31 0.3095079
2016-12-30 0.9311655
2017-10-23 0.7495239
Could you better explain the statement above? The inception dates for all three ETFs are all after 2008 so what generates these returns in 2008? (XIV, ZIV in late 2010 & VXX in early 2009)
I’d be very interested in subscribing. As a retail investor let’s say I put $10K to work in an IRA. $50/month would be $600/year which is a 6% expense. While the results look quite good on paper it would be hard for me to justify paying much more than that for such a specialized market. None the less I’d certainly be interested in trying it if you decide to move forward.
I have synthetic data from another person who reconstructed the ETFs from futures.
Looks great. Is that trading EOD or the next morning? If EOD, can we get the “pseudo” signal ~15 min before close so we have enough time to trade? I guess starting with $25/month as a trial period and once we have really observed it for ~3 month the price can be >=$50/month. The C2 strategist usually can provide backtest and live trades time stamps but I guess you do not want to disclose too much. At least we should know if there is any leverage involved and how roughly how much time is in ZIV as the liquidity is kind of low for it. Personally, if it is below $50/month I will at least give it a try for ~3 month. Thanks.
I would pay for a reliable, tradeable volatility strategy. Do you have a longer backrest or is that the extent of the ETFs?
How many trades a year and what is the winning %?
Thanks – Peter
Sent from my iPhone
>
Approximately 50 transactions a year.
I’m interested in your Vol strategy, few questions you could possibly address in next blog post:
1) How often does it trade? 2) What kind of orders to you place (MOO, MOC, intraday)? 3) what’s the average holding duration? 4) what’s the longest draw down period? 5) anything > $200/ month, I’d prefer something like a waiver of the monthly fee if the strategy doesn’t perform in that month (high water mark approach of some sort). 6) other stats like profit factor, number of trades, max favorable excursion/ max adverse excursion during trade life, trade PnL histogram (if you bought a fix unit each trade)
Cheers, Kilian
1/3) Over the course of the backtest, there have been around 50 transactions per year. So we’re talking on the order of once a week, give or take.
2) Orders are backtested as MOC with a one day lag (EG it isn’t “observe close, transact close” but “observe close, transact next day’s close, or anywhere in between as you like”).
4) Longest drawdown was 160 days.
The site I have in mind, Patreon, doesn’t really alternate on a variable structure. As usual, past performance isn’t indicative of future results. Certainly, I don’t intend on charging $200/month, as I can’t guarantee a strategy will make a high water mark every month. However, only 13% of quarters have ended in a loss in the backtest.
It would be great to have a structure that mimics performance: one pays 50$ a months (1% of 5000 as that would prob be the minimum to rade these signals) and if the past month’s eturn is negative, the next month is free (if you paid the previous month) I was thinking to market my Vol algo’s this way.
Pingback: Quantocracy's Daily Wrap for 10/24/2017 | Quantocracy
would be interested!
I’m surprised people seem so reluctant to talk price. I’d be willing to pay $30-$50 per month.
Nice work Ilya!!
but 2008 in this bullish (low vol) market is too narrow. At least, could you run a Montecarlo simulation (boot R package) with all the data you have, and share your results?
I would be interested if it was around $50, if much higher than that would need more evidence/track record etc. A different way to look at this is what kind of capital would someone deploy in a strategy they are just starting to look at, lets say it is 10k. Scale the strategy to 10 vol ( a rough and ready rule of thumb that actually works surprisingly well for money management) and you get expected annual gain of 2,3k. Take 20% as a performance fee and you arrive at rougly 500 bucks a year. So I would say $50 per month is an upper limit, at least initially.
Would it be simply the trade signals or a learning opportunity? I would likely be interested in both but might pay more for the thought around the analysis
I’ve already written about a rough prototype in the past here: https://quantstrattrader.wordpress.com/2014/12/10/an-update-to-the-robustness-heuristic-and-a-variation-of-a-volatility-strategy/
The strategy has evolved since then, and you’d receive the signals.
Would you run it on Collective 2, so we could trade it automatically? Why do you think this strategy has been capable of making much more than a XIV buy and hold strategy, what does the “edge” consist on?
I won’t run it on collective2, since I’d need to pay them a monthly fee up front, so forget that noise.
As for this strategy’s edge, risk management and minimizing free parameters.
Ilya, I’d be interested. Let me know what you decide.
The service is now launched ^_^
Hi Ilya! Long time lurker (and fan of your work) finally coming out.
I would want some more info (like a fact sheet with the basics) and also some out of sample testing before making a go for it. With that being said, my highest price would be in the ballpark of 15-20 $/month. Please add my email to the interest list. Since Im a european, please consider the payment methods as well, to broaden your potential your customer base (paypal or credit card/bitcoin etc). Apologies i advance for spelling misstakes (no auto correct on my phone in english).
Keep up the good work and a big thank you from an aspiring data scientist/hobby algo-programmer! :)
The service is launched, but it costs $50/month.
Where do I sign up?
https://www.patreon.com/quantstrattrader
Pingback: Comparing Some Strategies from Easy Volatility Investing, and the Table.Drawdowns Command | QuantStrat TradeR
Pingback: Comparing Some Strategies from Easy Volatility Investing, and the Table.Drawdowns Command – Cloud Data Architect
Hello, with the new strategy since March, what’s your annual Return? (no exist XIV)
I should update it soon, but can send you the returns in an email.
Yes please.
Thank you
Also interested in returns since strategy update.
Thank you so much for this article! I found the Alpha Vantage stock API quite comfortable to use, after hearing about it in your blog.
Recently, the free API seems to return only un-adjusted price data, hence it is necessary to correct for stock splits. In my freshly-opened blog i describe how the API can be easily used in Wolfram Mathematica, and how stock splits can be accounted for: https://volatilitymaster.wordpress.com/2021/12/26/01-loading-manipulating-freely-available-stock-data-in-mathematica/
Pingback: #01: Loading & manipulating freely available stock data in Mathematica – Volatility Master